Product Overview
GTA——Graphic Tolerance Analysis
Graphic Tolerance Analysis is a graphic tolerance analysis software independently developed by Pan-i Information Technology (Shanghai) Co., Ltd. The software is used to help users quickly build dimension chains, GTA automatically judges the increase and decrease rings, and carries out tolerance analysis and calculation. So it predicts the deviation inherent in the design. It also manages and analyses the size data of the analysis. The software will greatly improve the efficiency of tolerance analysis, improve the accuracy of analysis, and play an important role in analyzing historical data.
l Graphical modeling
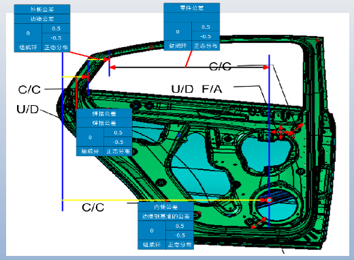
Simple, fast and efficient establishment of dimension chain on the plane graph of the model.
l Dimension chain checking
Automatically check the logic and assembly relationship of the chain.
l Increased links or decreased links distinguishing
Automatically judge the increased links or decreased links.
l Hole-pin floating
Describe how pins move in holes or slots.
l General tolerance analysis method
Extreme value method: According to the upper and lower limit deviation of tolerance, the worst closed loop result is obtained.
Probability method: tolerance analysis based on RSS analysis method and theory.
l Tolerance contributor
Analyze the influence of each composition loop the results.
l Tolerance database
Quickly import tolerance data by building corresponding tolerance database.
l Standard template database
Tolerance design and analysis can be completed quickly.
l Data analysis
Various algorithms are used to test the data distribution.
l Automatic report generation
Individual report output: For a size chain, the size chain report is automatically output.
Batch report output: For a project, automatic batch output of all dimensional chain analysis reports under the project.
l Customization Secondary Development
Secondary development of data analysis, report template, tolerance database and standard template database, etc.

Step1:
Dimension chain drawing can be completed by moving the mouse. Part drawings can be pasted in the drawing window to help users draw dimension chain.

Step2:
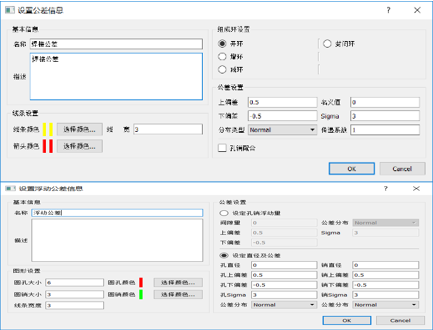
Import tolerance information: tolerance name, tolerance description, composition ring setting, tolerance value setting,hole-pinfloating setting and dimension chain appearance setting, etc.

Step3:
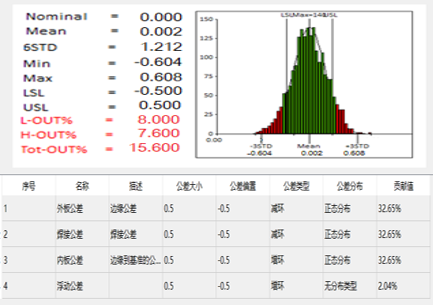
Select tolerance analysis method, calculate results, optimize tolerance according to contributoruntil the design goal is achieved.
